Week of October 30, 2026
Hello, Miami Springs. Here is your Weekly Market Report. If you are ready to buy or sell, The Leonard Real Estate Group is ready to earn your business. We are Miami Springs.
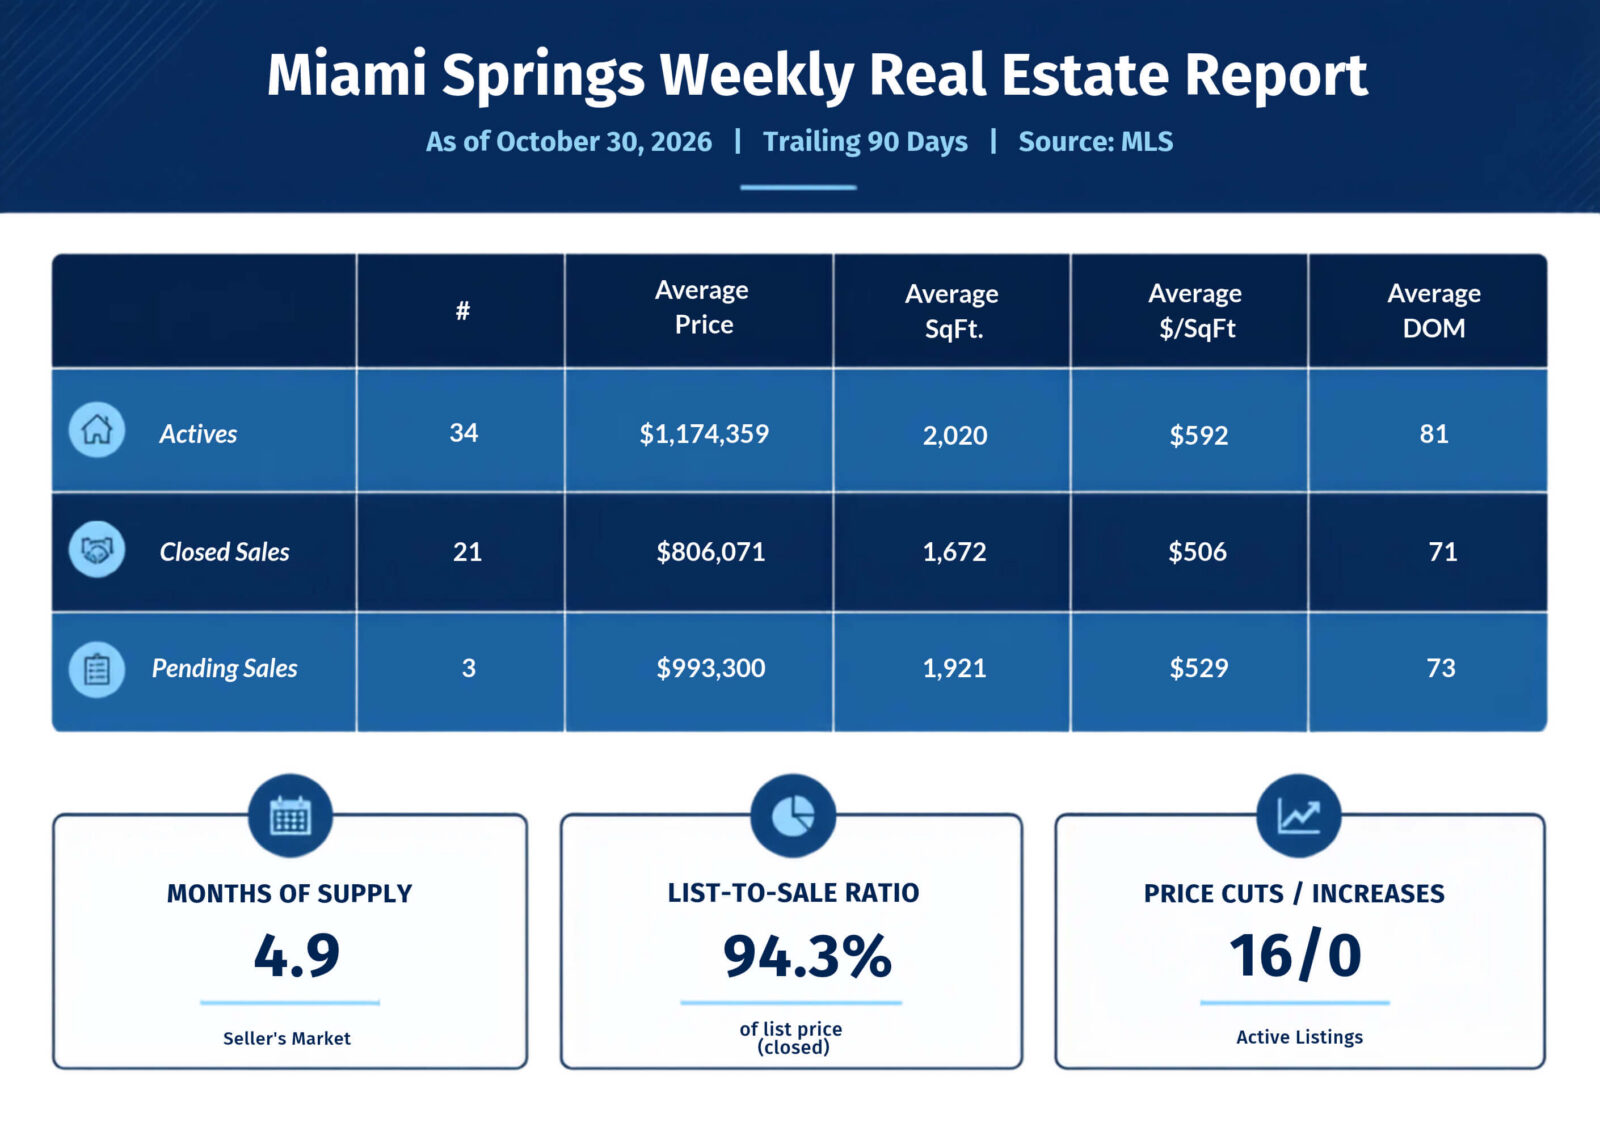
The table below shows the current status of the Miami Springs/VG single-family home market as of October 30, 2026. All figures reflect the trailing 90 days of MLS activity — closed sales, actives, pending, and everything else within the last 90 days — and all data is per the MLS.
 *Disclaimer: The data relating to real estate displayed on this website and the chart above comes from the Miami Board of Realtors MLS. All listing information is deemed reliable but not guaranteed and can be independently verified.
There are 34 active single-family listings at an average list price of $1,174,359, averaging 2,020 square feet at $592 per square foot. 21 homes closed at an average sale price of $806,071 (1,672 square feet, $506 per square foot), and 3 are pending at an average list price of $993,300 (1,921 square feet, $529 per square foot). The top of the active market is led by 325 Ludlam Dr at $2.5M, 1101 Wren Ave and 1100 Oriole Ave at $2.45M each, and 1080 Oriole Ave at $2.4M; 188 Cherokee St, the priciest listing in the data at $2.6M, is active with contract. Active listings have averaged 81 days on market, versus 71 days for homes that closed. Another 3 listings are active with contract and 4 were cancelled.
Sellers are still adjusting: 16 of the 34 active listings have taken a price cut, and none have raised their price. Months of supply sits at 4.9, which is a seller’s market (under 5 months is seller’s, 5–6 is balanced, over 6 is a buyer’s market), up from 4.1 last week and the highest reading in the weekly log. Closed sales are coming in at 94.3% of list price on average, so buyers are still negotiating roughly 6% off asking.
Mortgage rates: Freddie Mac’s 30-year fixed average was 7.24% on October 29, down from 7.32% the week before, its lowest level this month, and up from 6.17% a year ago.
Inventory breakdown: Under $500K: 0. $500–600K: 1. $600–700K: 3. $700–800K: 6. $800–900K: 6. $900K–$1M: 7. $1–2M: 5. $2–3M: 6. $3M+: 0. Just under half of the active inventory (16 of 34) is priced below $900K, while six listings sit between $2M and $3M.
Off-market activity: 4 listings left the market without selling this period (3 expired, 0 temporarily off market, 1 withdrawn).
The numbers point to a market where pricing is doing the work. Closed homes average $806,071 while the average active asking price is $1,174,359, a gap pulled up by the six listings between $2M and $3M, and the 16 price cuts show sellers adjusting toward where buyers are actually closing. Compared to last week, active inventory is up from 33 to 34, closed sales are down from 24 to 21, months of supply moved from 4.1 to 4.9, and the average closed price slipped from $831,813 to $806,071.
As always, if you are ready to buy or sell, we are ready to earn your business. We are Miami Springs.
- Charlie & Sean
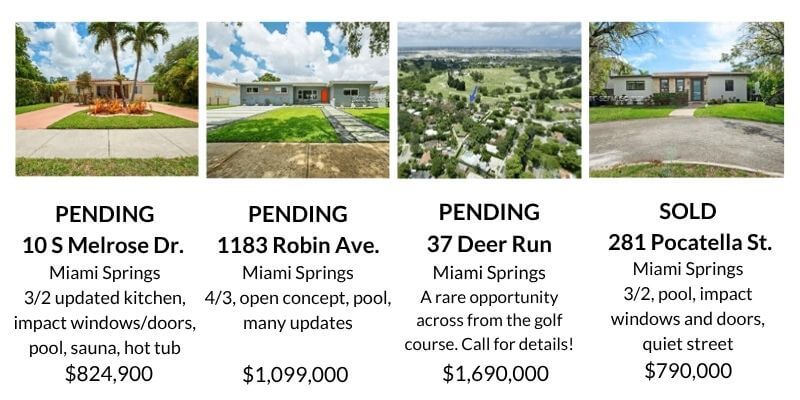
Featured Listings
 A complete list of all the properties for sale in Miami Springs or any other area of Miami-Dade County can be sent to you on regular basis.

Request it at:  charlie@leonardrealestategroup.com