 FORECLOSURE STARTS AND REOS RISE
via themortgagepoint.com—According to ATTOM’s April 2026 U.S. Foreclosure Market Report, there were approximately 42,430 U.S. homes with foreclosure filings—default notices, scheduled auctions, or bank repossessions—down an estimated 8% from the previous month and up 18% from the previous year.
“Foreclosure activity continued its gradual trend higher in April, with both foreclosure starts and completed foreclosures posting annual gains,” said Rob Barber, CEO at ATTOM. “While overall filings declined from the previous month, the year-over-year increases suggest lenders may be working through distressed inventory as higher borrowing costs and affordability challenges impact some homeowners. Even so, foreclosure activity remains significantly below pre-pandemic levels.”
Key Findings from the April 2026 U.S. Foreclosure Market Report:
There are 42,430 U.S. properties with a foreclosure filing, which is up approximately 18% from a year ago but down 8% from March—continuing a year-long trend of annual rises in foreclosure activity.
Completed foreclosures (REOs) jumped 42% annually to 5,098.
Foreclosure starts increased 12% annually to 28,414.
Foreclosure activity is still much lower than it was before the pandemic, despite yearly rises in foreclosure filings.
Nationwide, in April 2026, one out of every 3,388 dwelling units had a foreclosure filing. With one foreclosure filing for every 1,739 housing units, Delaware has the highest foreclosure rate in the U.S. South Carolina trailed closely behind (one in every 1,745 housing units), followed by Florida (one in every 2,092 housing units), Indiana (one in every 2,129 housing units), and Illinois (one in every 2,262 housing units).
Lakeland, FL, had the highest foreclosure rate among metro areas with 500,000 or more residents in April 2026, with one filing for every 1,221 housing units. Columbia, SC (one in every 1,287), Charleston, SC (one in every 1,483), Bakersfield, CA (one in every 1,566), and Cape Coral, FL (one in every 1,628 housing units) followed the Lakeland metro.
Which States Lead in Foreclosure Starts?
The study showed that U.S. lenders began foreclosing on 28,414 U.S. properties in April 2026, an estimated decrease of 6% from the previous month but an increase of 12% from the previous year.
States with the highest number of foreclosure starts in April 2026 were:…READ MORE
The Current Miami Springs Market

This week there are thirty-one (31) active listings in the MS/VG markets. A 10% decrease in inventory since last week. About 45% are priced over $1,000,000. Of those, three (3) listings are over $2million, and one is asking close to $4 million!
We have experienced a busier Spring selling/buying season so far this year! SELLERS, LIST NOW(!) if you are thinking about selling! There are still qualified Buyers out there! More increases in inventory in the months ahead?? I think so.
Mortgage interest rates have increased a bit. They are now about 6-6.2%. Uncertainty with the war and gas prices may impact demand. However, there are still qualified buyers looking for the right property. Timing is everything. Days on the market (DOM) are on average 61 days. Some houses sell quickly. It all depends on pricing, condition and location, location, location. The decrease in interest rates should result in increased sales activities. It is important to price the property right.
Inventory Breakdown:
There are no properties priced between $500,000-$600,000; three (3) properties are priced between $600,000-$700,000; five (5) between $700,000-$800,000; four (4) between $800,000-$900,000; five (5) are priced between $900,000-$1,000,000; ten (10) between $1-2 million; three (3) are listed for over $2 million; and one (1) is listed for over $3 million.
TIME TO BUY OR SELL? CALL US FOR AN EVALUATION
During the period of May 8, 2026 through May 15, 2026, there were reported 0 new listings, 1 closed sale, 3 pending sales, 2 active with contract, 0 expired listings, 0 cancelled listings, 0 temp off market, 0 price reductions, and 0 price increases.
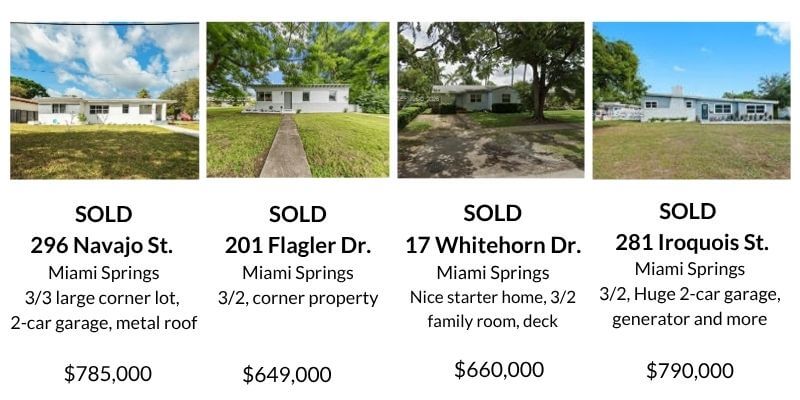
HOW DOES YOUR HOUSE COMPARE?
The table below shows the current status of the Miami Springs/VG real estate market as of May 15, 2026. All closed sales are within the last 90 days.
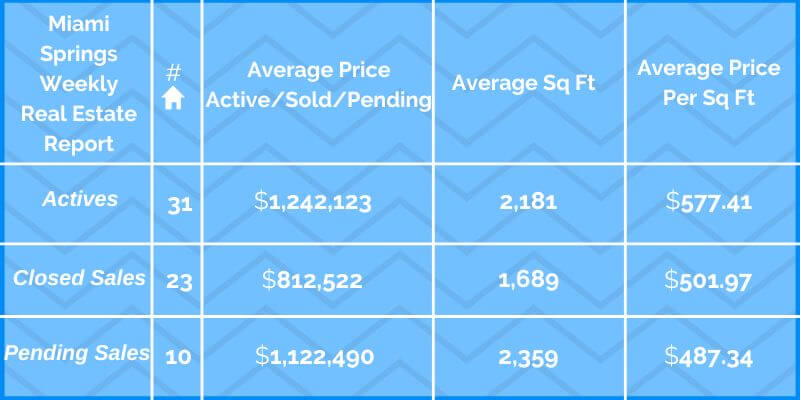 *Disclaimer: The data relating to real estate displayed on this website and the chart above comes from the Miami Board of Realtors MLS. All listing information is deemed reliable but not guaranteed and can be independently verified.
 A complete list of all the properties for sale in Miami Springs or any other area of

Miami-Dade County can be sent to you on regular basis.

Request it at:  charlie@leonardrealestategroup.com
………………………………………………..……………………………………………………………………………
We are the Miami Springs Experts
however, we service all of South Florida
Let Us Show You How We Can Get Your Property Sold
at the Highest Possible Price