Week of September 4, 2026
Hello, Miami Springs. Here is your Weekly Market Report. If you are ready to buy or sell, The Leonard Real Estate Group is ready to earn your business. We are Miami Springs.
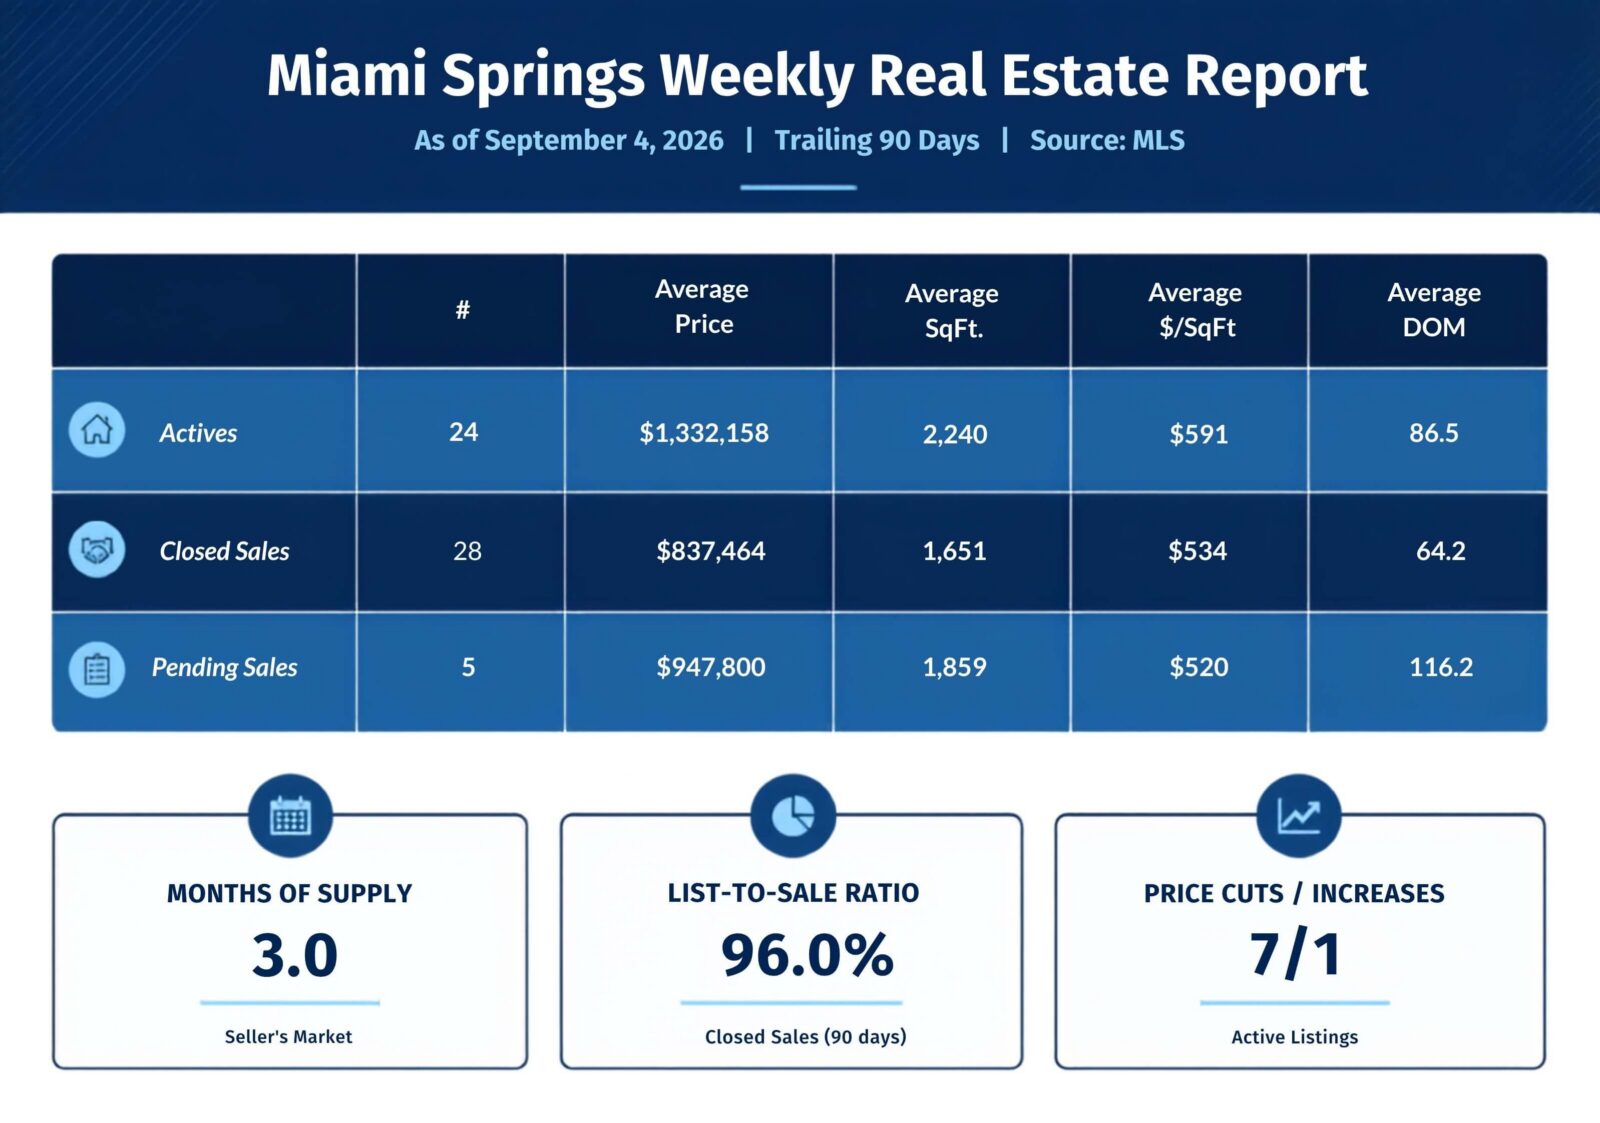
The table below shows the current status of the Miami Springs/VG single-family home market as of September 4, 2026. All figures reflect the trailing 90 days of MLS activity, and all data is per the MLS.
*Disclaimer: The data relating to real estate displayed on this website and the chart above comes from the Miami Board of Realtors MLS. All listing information is deemed reliable but not guaranteed and can be independently verified.
There are twenty-four (24) active single-family listings in the MS/VG market right now, averaging $1,332,158 on about 2,240 sq ft, or $591 per sq ft. Another six (6) listings are active with a contract. Over the trailing 90 days, twenty-eight (28) homes closed, averaging $837,464 on roughly 1,651 sq ft, or $534 per sq ft. Five (5) more are currently pending sale, averaging $947,800 on about 1,859 sq ft, or $520 per sq ft.
There is one (1) active listing over $3 million (409 De Leon Dr, $3,967,000) and four (4) more over $2 million (188 Cherokee St, 901 Dove Ave, 325 Ludlam Dr, and 588 Miller Dr). Those five listings are averaging 129 days on market. On the closed side, the top sale of the period was 37 Deer Run at $1,650,000, followed by 520 Morningside Dr at $1,500,000. Seven of the twenty-eight closings came in at or above asking — 640 Cardinal St sold for $600,000 against a $565,000 list and 240 Nahkoda Dr closed at $701,000 on a $699,999 list, while 550 Cardinal St, 240 Lenape Dr, 550 Quail Ave, 400 Morningside Dr, and 831 Wren Ave each closed exactly at list. Days on market for active listings averages 86.5 days, down sharply from 105 last week. Pending sales averaged 116 days on market before going under contract, and closed sales averaged 64 days before closing. There were seven (7) price reductions and one (1) price increase (409 De Leon Dr) among current listings.
Miami Springs/VG is running at an estimated trailing pace of about 8.1 sales per month. Against 24 current active listings, that puts the market at roughly 3.0 months of supply — solidly in seller's market territory (under 5 months) and the tightest reading in the log. Homes that closed over the trailing 90 days sold at an average of 96.0% of list price, up from 95.6% last week, so sellers continue to hold most of the leverage.
Mortgage rates moved up modestly this week, with the 30-year fixed averaging 6.71% per Freddie Mac's Primary Mortgage Market Survey (published Thursday, 9/3/26), up five basis points from 6.66% the week before. The 15-year fixed averaged 6.04%, up from 5.98%. A year ago the 30-year fixed averaged 6.50%. Freddie Mac's chief economist noted that purchase demand has remained relatively stable.
Inventory Breakdown (Actives): There are zero (0) properties priced under $500,000; one (1) between $500,000–$600,000; one (1) between $600,000–$700,000; four (4) between $700,000–$800,000; five (5) between $800,000–$900,000; three (3) between $900,000–$1,000,000; five (5) between $1–2 million; four (4) between $2–3 million; and one (1) over $3 million.
Also this period: three (3) listings expired, two (2) went temporarily off market, and two (2) were withdrawn.
Inventory tightened for a third straight week. Active listings fell from twenty-seven to twenty-four while the under-contract and pending pipeline nudged up from ten to eleven, pulling months of supply from 3.3 down to 3.0 — the tightest reading anywhere in the log. Average days on market for actives dropped again, from 105 to 86.5, the second sharp decline in two weeks, and the reason is visible in the off-market column: the seven listings that expired, went temporarily off market, or were withdrawn this period carried some of the oldest inventory in the market, including one at 592 days and another at 328. What is left skews newer. Closed sales eased from thirty-one to twenty-eight and the average closed price slipped from $855,161 to $837,464, but that is a size story more than a price story — average closed square footage fell from 1,751 to 1,651 while closed price per square foot actually rose from $518 to $534. The list-to-sale ratio improved four tenths of a point to 96.0%, and seven cuts against a single increase keeps the same message intact. The number worth watching is the spread: actives are asking $591 per square foot while closings are clearing at $534, a gap of roughly 11%, and nine of the twenty-four actives still sit in the $700,000 to $900,000 band where the competition is thickest.
As always, if you are ready to buy or sell, we are ready to earn your business. We are Miami Springs.
- Charlie & Sean
 miamidadeclerk.gov—The deadline to file petitions for tax year 2026 is September 18, 2026.…READ MORE
MORTGAGE RATES CLIMB TO 6.71%, A NEW HIGH FOR 2026
realtor.com—The Freddie Mac 30-year mortgage rate increased 5 basis points to 6.71% this week, following the rise in the 10-year Treasury yield. Mortgage rates have been climbing since the start of the US-Iran conflict in late February and hit a new high for 2026. The Middle East conflict has put upward pressure on oil prices, fueling inflation and pushing it further from the Fed’s 2% target. When the conflict appeared to be nearing resolution, bond yields declined and mortgage rates followed suit. But the latest escalation in Middle East tensions has driven oil prices higher, reviving inflation concerns and pushing yields and mortgage rates back up..…READ MORE
Featured Listings
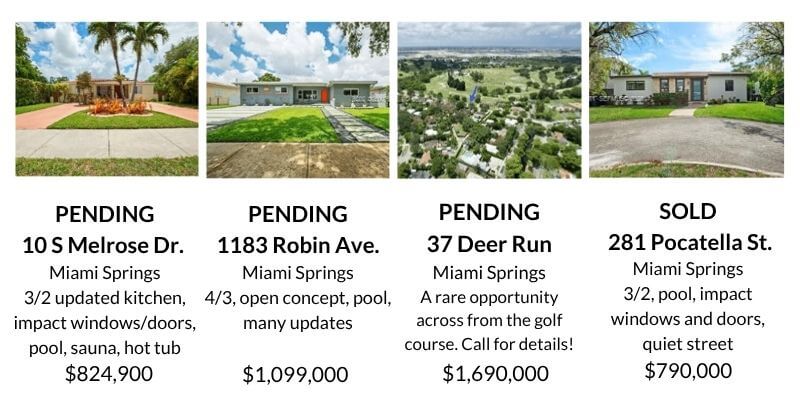
 A complete list of all the properties for sale in Miami Springs or any other area of Miami-Dade County can be sent to you on regular basis.

Request it at:  charlie@leonardrealestategroup.com